Software has become a core asset class for private credit. And yet the classification system the market relies on to distinguish one software company from another was designed for equity investors, not credit analysts.
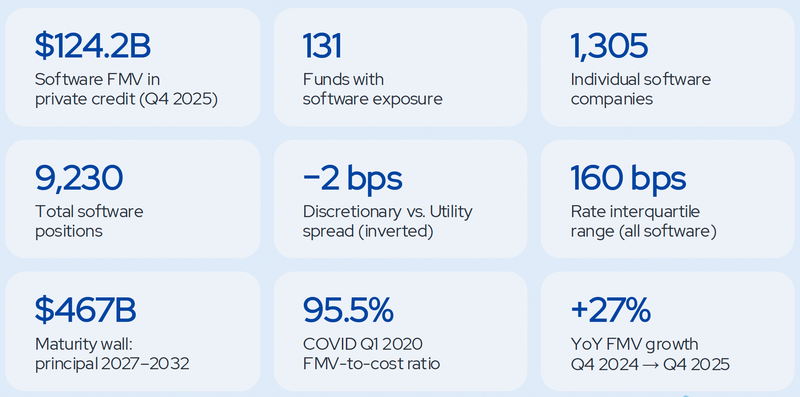
Private credit now holds $124.2 billion in fair market value across software companies. Spread over 131 funds and 1,305 companies as of Q4 2025. By any measure, software has become a core asset class for the industry. And yet the classification system the market relies on to distinguish one software company from another was designed for equity investors, not credit analysts.
GICS assigns nearly every recurring revenue software company to the same sector bucket. A core banking platform that would take a regional bank three years and $40 million to replace sits in the same classification as a website builder that a marketing director can swap out over a weekend. One has switching costs that function like a contractual moat. The other has switching costs that function like a subscription checkbox. GICS treats them as the same credit risk. They are not.
This matters because the fundamental question in software credit is not "how fast is revenue growing?" or "what is the net retention rate?" Those metrics describe expansion, not resilience. The fundamental question is: if this borrower's customers enter a downturn, what happens to the cash flow that services our debt?
The answer depends on how deeply the software is embedded in the customer's operations, whether the customer's budget for that software is tied to economic cycles, and which executive owns the renewal decision. None of these dimensions appear in a GICS code. None of them are captured by ARR or NRR alone.
The Velcro Score Framework
The Velcro Score measures one thing: how tightly a software company grips its customers' operations and therefore how predictable its cash flows are when those customers come under pressure.
A high Velcro Score means the software is deeply embedded, budget protected, and owned by a function that cannot be eliminated. A low Velcro Score means the software is substitutable, budget exposed, and owned by a function that shrinks first in a downturn.
The score is built on three axes. Each captures a different dimension of the same underlying credit question: how replaceable is this software, and who bears the pain of replacing it?
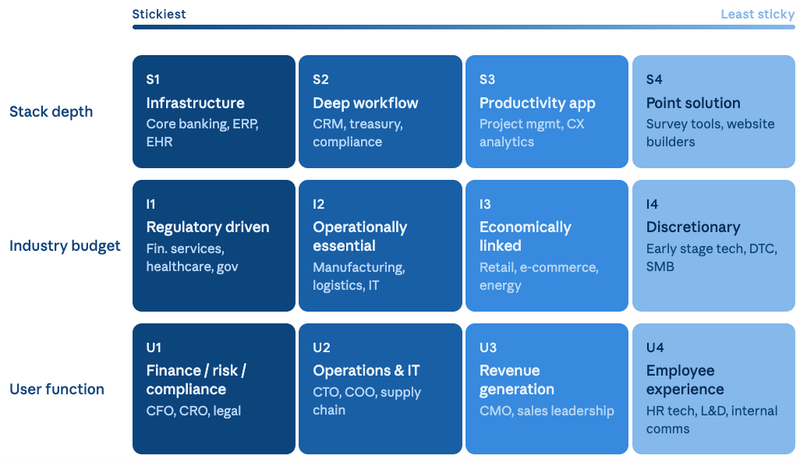
- Axis 1: Stack Depth (S1 to S4) measures proximity to the operating foundation of the customer's business. S1 replacements require board decisions and years. S4 replacements require a department head email.
- Axis 2: End Industry Budget Stickiness (I1 to I4) asks whether the customer's budget for this software is correlated with economic cycles. I1 spend is mandated by regulators. I4 spend is a growth investment with no operational floor.
- Axis 3: End User Function Criticality (U1 to U4) is the most novel axis. A company can lay off 20% of its sales team. It cannot lay off 20% of its compliance officers without regulatory consequence.
Four Credit Archetypes
These three axes produce four archetypes, each with a distinct credit character:
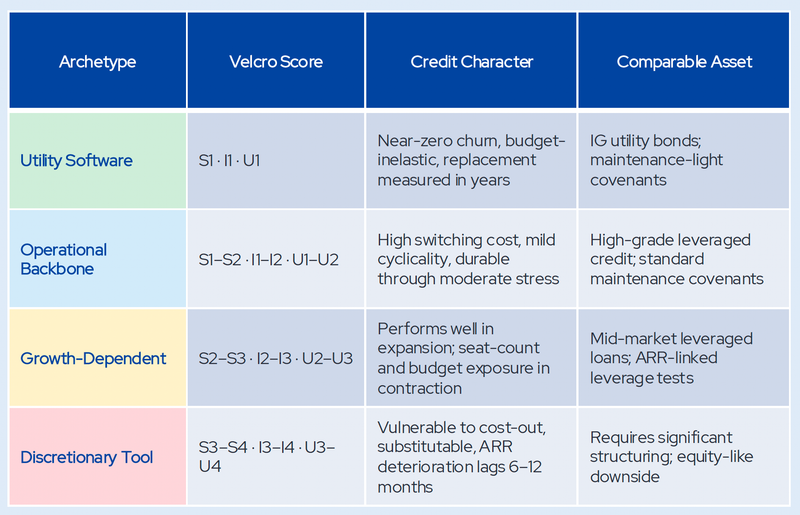
Two software companies at the same spread and leverage but different archetypes represent a relative value mispricing. The Velcro Score makes that visible.
PRISM data already shows the mispricing is real. Discretionary Tools actually price 2 basis points tighter than Utility Software. The market is not merely under compensating for risk. It is pricing the riskiest software credits as if they are safer than the safest ones. More on that in a forthcoming post.
PRISM Private Credit Analytics provides institutional investors with proprietary data, analytics, and frameworks for private credit portfolio analysis. The Velcro Score is a component of the PRISM Software Credit Classification System.