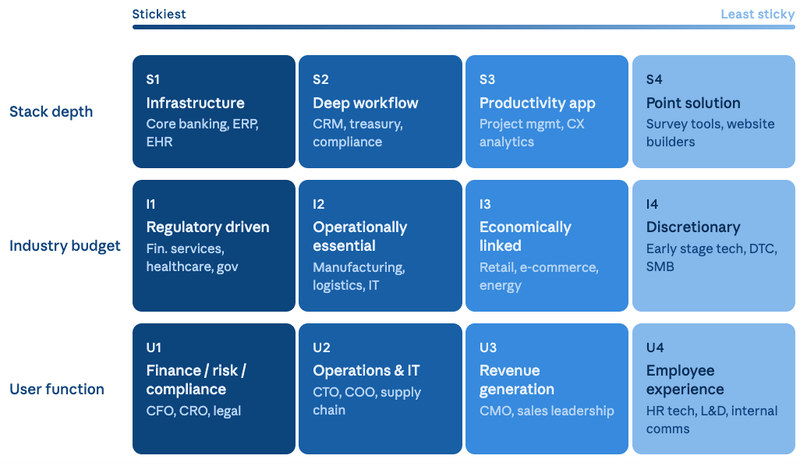
PRISM's Velcro Score classifies software credits into four archetypes based on stack depth, budget stickiness, and user function criticality. Utility Software sits at the top: near zero churn, budget inelastic, replacement measured in years. Discretionary Tools sit at the bottom: substitutable, cycle exposed, with ARR deterioration that lags reality by 6 to 12 months. The full framework was introduced in an earlier post. This piece applies it to real fund portfolios and asks a simple question: is the market pricing the difference?
The answer is no.
The 20 Point Gap
PRISM classified the software holdings of the ten largest BDC software lenders by Velcro Score archetype. The divergence is stark.
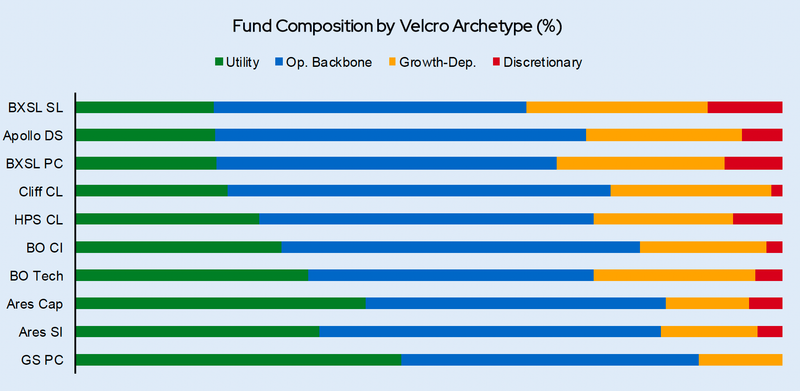
Goldman Sachs Private Credit holds a software book that is 46% Utility Software, the highest concentration among major lenders. Discretionary exposure rounds to zero. At the other end, Blackstone Secured Lending carries just 20% Utility Software, with over a third of its book in Growth Dependent and Discretionary credits. The "secured lending" label masks a software portfolio with meaningful mid market and equity like risk.
PRISM assigns each fund a Velcro Credit Quality Score based on the weighted composition across archetypes. The range spans nearly 20 points, from Goldman Sachs at 82 (investment grade equivalent) to Blackstone Secured Lending at 62 (covenant protection territory).
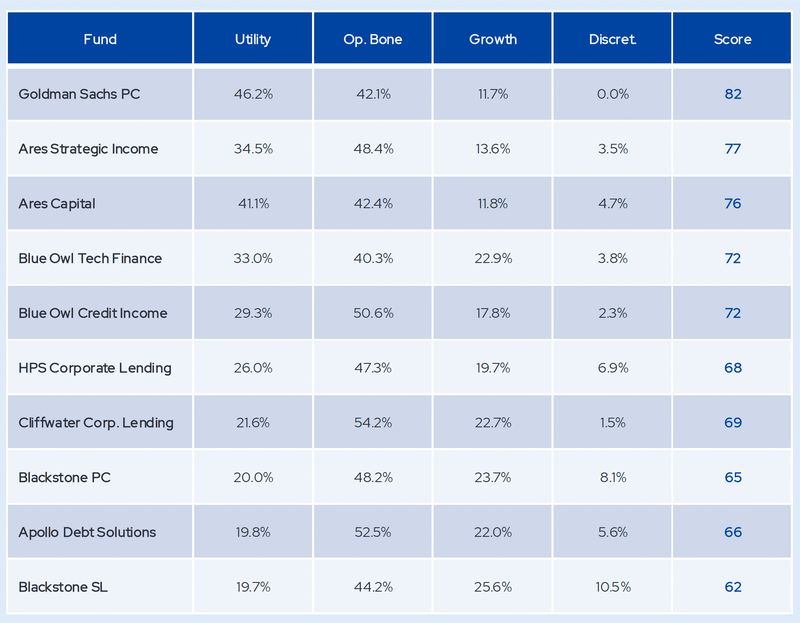
That gap is invisible in any standard fund factsheet or LP report. Two funds can report identical software exposure as a percentage of AUM and carry fundamentally different risk profiles underneath. Without an archetype lens, allocators are comparing labels, not portfolios.
The Inverted Risk Premium
If the four archetypes carry structurally different risk profiles, the market should compensate lenders accordingly. It does not. Discretionary Tools actually price 2 basis points tighter than Utility Software. This is not under compensation. It is an inversion. The market is pricing the riskiest software credits as if they are safer than the safest ones.
The Squarespace versus One Inc comparison makes the point concrete. Squarespace (S4, I4, U4) is a Discretionary Tool whose customers can cancel monthly. One Inc (S1, I1, U1) is Utility Software embedded in insurance claims infrastructure. Squarespace prices at 7.04%. One Inc prices at 6.42%. Most striking: Squarespace at 7.04% sits 113 basis points below the Utility Software average. A portfolio manager buying Squarespace debt accepts far less yield than the average infrastructure layer credit while taking on a borrower with no structural switching costs.
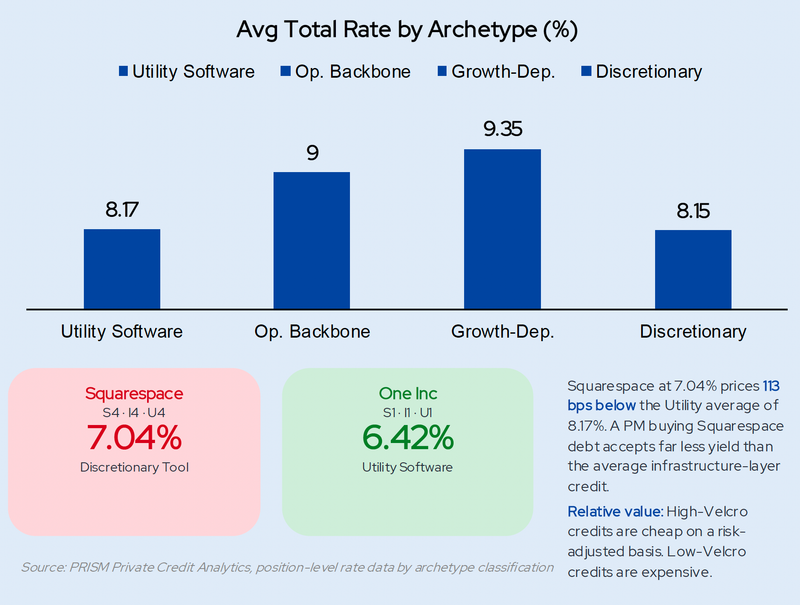
High Velcro credits at current spreads are cheap on a risk adjusted basis. Low Velcro credits are expensive. The relative value signal is clear.
What This Means for Underwriting
The Velcro Score is not just a portfolio analytics tool. It carries direct implications for how software credits should be structured. The covenant framework should follow the archetype: maintenance light for Utility Software, progressively tighter through to springing covenants with NRR triggers for Discretionary Tools. The critical insight is timing. PRISM's historical data suggests a 6 to 12 month lag between economic deterioration and ARR deterioration for Discretionary credits. By the time trailing metrics reflect the problem, the borrower may have already burned through its liquidity cushion.
[Exhibit 11: Covenant and Monitoring Framework by Archetype]
A fund with 30% of its software in Utility and Backbone carries less downside than a fund with 20% in Growth Dependent and Discretionary. The Velcro Score makes that visible. The question is whether lenders develop that view before or after the cycle provides the lesson.
PRISM Private Credit Analytics provides institutional investors with proprietary data, analytics, and frameworks for private credit portfolio analysis. The Velcro Score is a component of the PRISM Software Credit Classification System.